It seems like you’re trying to plot the time taken to compute the factorial of each number from 1 to 150. However, there are a few issues with your code:
- You’re not storing the time taken for each factorial computation. Instead, you’re overwriting dt in each iteration.
- The plot function is called inside the loop, which is not necessary and can cause issues.
- The plot function is not defined in your code. You might want to use a library like matplotlib.pyplot for plotting.
import numpy as np
import time
import math
import matplotlib.pyplot as plt
n = np.arange(1, 151)
dt = np.zeros_like(n, dtype=float)
for i in range(150):
start_time = time.time()
math.factorial(i+1) # replace np.math.factorial with math.factorial
dt[i] = (time.time() - start_time)
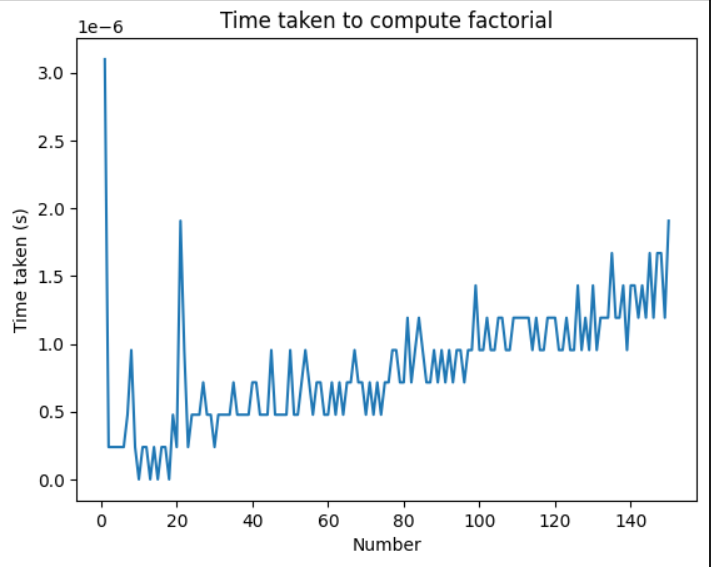
plt.plot(n, dt)
plt.xlabel('Number')
plt.ylabel('Time taken (s)')
plt.title('Time taken to compute factorial')
plt.show()
Support On Demand!