| Parameter | Python | R |
|---|---|---|
| General | Being a general-purpose programming language, Python is widely used for data analysis and scientific computing. | R is predominantly used for statistical computing and graphics due to its functional programming environment. |
| Release Date | First Released in 1991 as Python 0.9.0 | First released in August 1993 |
| Designed By | Guido van Rossum | Ross Ihaka and Robert Gentleman |
| Objective | A general purpose language used for Data Science, Web Development, and Embedded Systems | A statistical programming language used for Data Science and Statistical Modeling |
| IDE | PyCharm, Spyder, Thonny, IPython | RStudio, Eclipse, StatET, R KWARD | Packages and Libraries | Numpy, Pandas, Pytest, Matplotlib, Requests, TensorFlow, sci-kit-learn, PyTorch, Theano | Ggplot2, data.table, dplyr, Plotly, tidyr, readr, stringr, lubridate, shiny |
| Syntax | Python has a relatively simple syntax and is easy to learn. | R has a complex syntax and a relatively large learning curve. |
| Workability | Python consists of many easy-to-use packages | R easily performs matrix computation and optimization. |
| Integration | Programs that Run Locally | Well-integrated with web apps |
| Database Handling Capacity | Handles huge database size | Handles all database sizes |
| Community | Python has a more robust community for ongoing support and development. | R Community is comparatively smaller. |
| Learning Curve | Linear and smooth | Difficult at the beginning |
| Machine Learning | Excellent for machine learning with libraries such as Scikit-learn and TensorFlow | Equally good for machine learning with libraries such as Caret and H2O. |
| Data Handling Capabilities | Python handles structured data effectively and the libraries are efficient for data manipulation, data cleaning, visualization, and for importing and exporting the data. | R is well suited to handle both, structured and unstructured data. With different syntax, it provides similar data manipulation and cleaning functionality along with visualization. |
Quick Summary:
In a short time, Python and R gained a lot of momentum and love from the developer community. Yet, Python vs R is an ongoing debate. Even though both languages are significantly used in machine learning, artificial intelligence, and data science projects; both have different strengths, limitations, and weaknesses.
If you are confused about choosing the best open-source language for your new data science project, then our unbiased Python vs R Comparison will help you escape your misery.
Table of Contents
Introduction to Python and R
Python and R are similar in many ways; both are open source, free to download, and play a dominant role in bringing data science projects to life. Which programming language is best for data science tasks – is not the right question. But how to use and derive value out of both Python or/and R is the right question to ask.
What is Python?
According to python.org, Python is a high-level, interpreted programming language. It is developed with a vision to convert a long-lasting possibility of rapid application development into a reality. It combines the best of dynamic semantics and dynamic typing so that we can use it as a simple scripting language and connect existing components.
Python’s readable syntax and its extensive standard library provide a high-level programming language that non-programmers can easily understand. Due to the extended support offered by Python through its, modules and packages, it enables significant code reuse and advocates program modularity. Being an open-source language, developers can download and use it on all platforms for free.
Advantages of Python
- Python is open-source and freely downloadable.
- You can change, customize, and contribute to Python libraries.
- Python is used in diverse tasks, including embedded systems, data science, machine learning models, robotics, and more.
- Python offers cutting-edge APIs like TensorFlow, PyTorch, Keras, NumPy, etc., useful in neural network development.
- Python is a user-friendly programming language.
- Python is fully secure, and its web frameworks are dominantly used for the development of web apps.
- Python is capable of handling large datasets, ensuring faster data file loading, and works seamlessly with the Big Data ecosystem.
Disadvantages of Python
- Python is slower than other programming languages like C, C++, and Java, as it is an interpreter-based language.
- Python performs poorly in statistical analysis compared to R due to a lack of statistical packages.
- Sometimes developers may face runtime errors due to the dynamically typed nature.
- The flexible data type in Python consumes a lot of memory, causing tasks requiring heavy memory to suffer.
What is R?
According to r-project.org, R is a programming language that offers a comprehensive environment for statistical computing and graphics. John Chambers and colleagues at Bell Laboratories (now Lucent Technologies) developed the language R keeping the GNU project similar to the S language.
Equipped with multiple graphical and statistical techniques, R is one of the few fast, and flexible programming languages. As R offers an open source route, it is predominantly used by statistical researchers and programmers to conduct research in different methodologies.
Advantages of R
- R is an open-source language freely available for use.
- R allows developers to customize, contribute, and improve its libraries, source code, and features.
- Packages such as readr and dplyr help in the seamless conversion of unstructured data into structured data.
- It enables the easy creation of appealing graphs with notations and formulas with the use of ggplot and plotly.
- R has versatile packages that make the development of deep learning, data science, and statistical projects easy.
- It has an active and engaging community and forums offering endless support and development help to the R developer community.
Disadvantages of R
- R offers limited support for dynamic 3D graphics, as it needs critical modern features of a current and comprehensive programming language.
- R has a tendency to store all object oriented programming in its physical memory; thereby, increasing its memory usage. Hence, using it for Big Data is not convenient.
- Security is not that lucrative in R; hence, it cannot be embedded in web applications or used as a backend computation language.
- R has an exorbitant and complex learning curve.
- The majority of packages in R could be faster compared to Python and MATLAB
Python vs R Comparison Table
The comparison parameters between Python vs R vary depending on the purpose for which you want to differentiate between the two. You can compare the use of R vs Python for data analysis or based on the object oriented of design, user base, learning curve, usage flexibility, technical limitations, features, etc.
To help you reach a quick conclusion, here is an image comparing Python vs R in a tabular form.
Do You Want Your Data Science Project to Get Stronger?
Hire Data Science Consultants from us and take your data science project to new heights by leveraging their cutting-edge skills to code in Python and R.
Python vs R: Realistic Comparison
Post-COVID, we are moving to a new technological frontier led by data science, artificial intelligence, and machine learning. These three front liners of the modern technology evolution play a significant role in bringing so many things into a reality that we seldom imagined. If you are aware of these technological evolutions, then you would be mindful that Python vs R for data science is a matter of interest and feud for many.
Both languages have many similarities and dissimilarities, many advantages and disadvantages, and strengths and weaknesses. Yet, you need clarification when it comes to choosing one between them. Let’s differentiate Python vs R on a more comprehensive level.
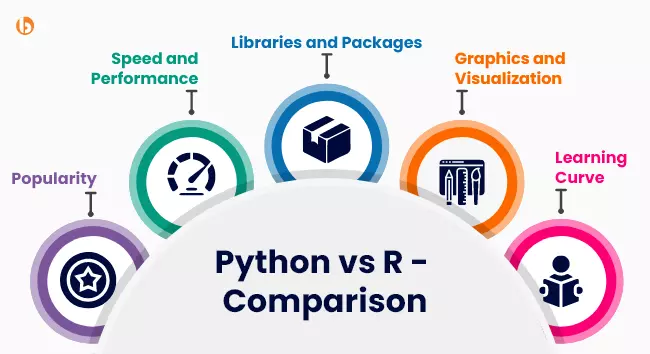
🟠 Popularity
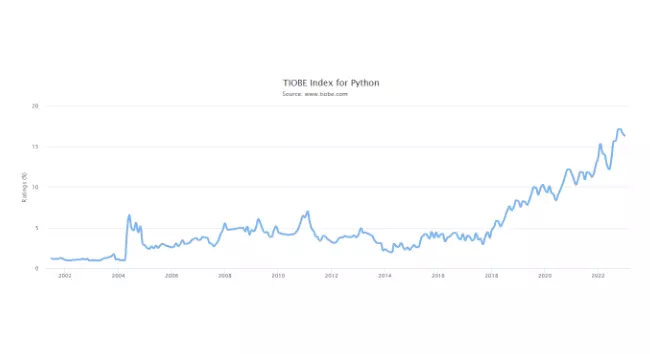
Python: According to The Importance Of Being Earnest (TOIBE) index, Python scaled the wide range from the day it was released. It reached No-1 in December 2022 with an overall rating of 16.36%, representing an increase in demand of 2.78% over the last year. Besides, according to Stack Overflow Developer Survey, Python became the third most popular language.
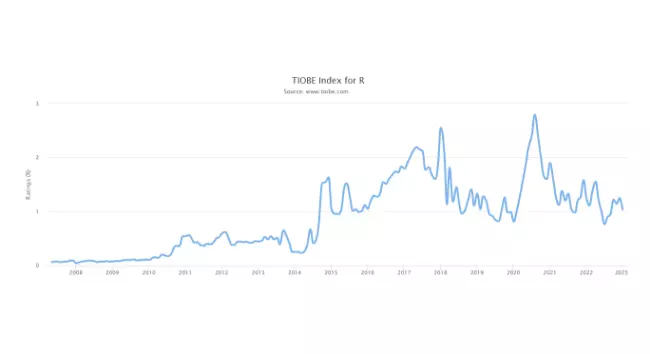
R: According to the Same TIOBE report, R is not as popular as Python, yet it does its career best by reaching No-13. R received a 1.04% rating; but slipped in demand and popularity by –0.21%. It is interesting to note that R was at No-8 in the year 2020, but it is decreasing in popularity year-on-year.
🟠 Speed and Performance
Python: As a high-level programming language, Python makes a perfect choice for building critical applications quickly. Although Python has earned more praise than R, they differ minutely in execution time and speed.
R: Conversely, R is a complex language where you need to write lengthy code even for simpler processes, increasing the development time. Similar to Python, even R is capable to handle larger and more robust data operations.
Both languages are slower than compiled programming languages like C or C++. Yet, they overcome this issue by allowing specific C or C++-based extensions to achieve the speed matching to the C language.
🟠 Libraries and Packages
Python: Python libraries and packages are collections of related code modules used repeatedly by different programs. Python libraries such as Matplotlib, Seaborn, and Plotly are used for plotting numerical data (Visualization). The Pandas library provides flexible high-level data structures and tools that are useful in data analysis, cleaning, and manipulation. The NumPy library doubles up as an ML tool that supports multidimensional data and large matrices. It has in-built mathematical functions for computations.
R: On the contrary, R is also equipped with various libraries and packages, like the ggplot2 library, often useful for data visualization, and the shiny package, widely utilized for building interactive web applications. Additionally, the RCrawler package is well known for web scrapping and domain-based web crawling, whereas tidyverse is excellent for data manipulation. CRAN is another alternative package for R, which is less standardized with a varied API and usage, making it hard to learn and combine.
R vs Python for data science is not a subject of debate, as they both offer thousands of packages and libraries you can use for free in your project. Python is an excellent choice for building full-fledged applications, and R would be a better option if you want to manipulate data from popular data stores. Suppose you can create, use, destroy, and manipulate various environments with multiple or different packages installed. In that case, archiving similar performance from R is a challenge due to the limitations of its packages.
🟠 Graphics and Visualization
Python: Several libraries in Python have been made available recently to create beautiful, stunning, and engaging data visualization and graphics. Libraries such as Matplotlib, Plotly, Seaborn, GGplot, Altair, Bokeh, and many more come with unique advantages to create stunning graphics and visualizations. You can use these libraries to create line charts, bar graphs, scatter plots, heat maps, and similar visualizations.
R: You must write a few lines of code in R to create beautiful and visually stunning graphics and visualizations. There are a series of packages available in R like Plotly, ggplot2, tidyquant, taucharts, ggiraph, geofacet, and many more for data visualization.
Some feel that visualization in R is more straightforward than extensive libraries in Python, rather than helping make data visualization a complex process. However, Seaborn and Matplotlib have debunked this myth, and Seaborn enables you to create stunning visualizations by writing few lines of code than what you will write in ggplot2.
🟠 Learning Curve
Python: Python has a smoother learning curve due to its simple syntax, which is similar to English. Many programmers find it easier to code in Python due to the less tie consumption in writing the code.
R: Many feel R has a longer or more complex learning curve. Due to the non-standardized code, R is a little difficult to master. Even some experienced programmers think that R could be more convenient, which has often made them awkward.
Although R is difficult for beginners and entry-level developers, statisticians and people with prior experience in statistics find it easier to understand. R developers often feel that Python focuses on less essential things. Yet, go with R, if you are looking for an easy to read and time-efficient programming language.
🟠 Popularity Index
Python
- According to the 2019 Stack Overflow Developer Survey, 41.7% of respondents agreed that Python had become the most commonly used language amongst them.
- The 2018 Kaggle survey revealed that the percentage using Python had increased from 51% in 2017 to 75% in 2018.
- 90% of Python developers remain loyal to the language, and only 5% switch from Python to R.
R
- In a similar survey, 5.8% of respondents reported using R over Python.
- A 2018 Kaggle survey found that the percentage of data scientists using R had decreased from 21% to 16% over the same period.
- 74% R users remain Loyal to the language, and about 10% switch from R to Python.
- Prefer using Python when you want to delve into data analysis or want to apply statistical techniques.
- Python is a good choice when you want to create something unique and innovative. You can use it for scripting websites and other applications.
- Python is suitable for projects wherein you need to incorporate statistical code into a production database or when you want to integrate data analysis projects with web apps.
- When your focus is academics and research, use R. You can also use it for exploratory data analysis.
- When creating complex statistical functions, use R. Leverage versatile statistical tests and models to create complex statistical analysis.
- Use R when your data analysis projects need a standalone computing analysis or an individual server.
- Python libraries such as sci-kit-learn, TensorFlow, and Keras significantly build ML models from scratch
- Python is easy to integrate with other languages.
- In terms of memory usage, Python outsmarts R.
- Python is preferred more due to execution speed and more straightforward syntax.
Python or R: For Data Science
Data science emerged a few years before and is constantly evolving. Many aspects of data science, like data pipelines and data collection, are automated daily. With new technologies and finely tuned requirements, many skilled professionals find it challenging to choose the correct programming language for their next data science project. We plan to help them escape this dilemma on our bang-on blog on Python vs R.
Keep reading to find the best programming language for your next data science project.
Data Collection
Python: It offers versatility in data collection. You can collect all forms of data, including CSV and JASON files, using Python. Besides, programmers can use it to import SQL tables into codes and collect data from the web using Python request libraries to create datasets in a shorter time.
R: The programming language R was developed to allow data analysts to import data from various data sources, including Excel, Text, and CSV files. R has some limitations regarding data collection, as it was primarily designed for basic web scraping. Programmers can create data frames in R by converting files built in SPSS or Minitab format.
Data Exploration
Python: There are numerous libraries in Python, efficient and highly capable of manipulating and exploring data to any extent. Programmers can filter, sort, and display data speedily. You can use some selected Python libraries to merge and join datasets; index and subset data that help in data manipulation.
R: Purposefully built for statistical analysis of larger datasets, R has versatile solutions that you can readily use for data exploration and manipulation. Programmers can utilize the dplyr package to select, filter, mutate, group, summarize, and join data. Besides, R allows for creating probability distribution statistical tests and data mining techniques.
Data Modeling
Python: With a modern and focused approach, Python offers multiple standard libraries used widely by Python developers for data modeling. For example, using NumPy for numerical modeling analysis, SciPy is a brilliant choice for scientific computing and calculations, whereas sci-kit-learn is an excellent choice for machine learning algorithms.
R: Tidyverse is a single package in R that is enough to import, manipulate, visualize, and report data. However, sometimes programmers must depend on external or third-party packages to perform specific data analyses in R.
Data Visualization
Python: Many of us feel that compared to R and some external data visualization tools, Python needs to improve performance and has limitations in creating engaging, attractive, and appealing data visualization. Specific libraries such as Matplotlib and Seaborn are widely used to visualize data by generating basic graphs and charts.
R: Created with a vision to visualize statistical analytical results, R can present data with stunning visualizations. Although data visualization in R can be done using basic graphics modules using charts and graphs, ggplot and ggplot2 tools make it possible to plot complex scatter plots with regression lines for engaging data visualization.
Python vs R: Which is Right For You?
When to Use Python?
Want to build secure, scalable and dynamic enterprise-level web apps?
Connect with us to hire Python developers for successful enterprise-grade application development
When to Use R?
R vs Python Use Cases
Python Use Cases
R Use Cases
Key Takeaways
Python and R became the preferred languages among developers and programmers in Data Science, ML, and AI. Both languages have opened a massive learning, discussion, and innovation community. R and Python have advantages and disadvantages, making it more challenging to choose between them. This blog, Python vs R, has helped you understand many unsaid things about these two languages. Yet, Python is more prevalent among data scientists.
At Bacancy, we leverage Python to deliver highly customized and requirement-specific data science projects. Leverage the experience and expertise of our expert team, hire Python Developers and data scientists to strengthen your next data science project.
Frequently Asked Questions (FAQs)
The significant difference between the two is Python is a general-purpose programming language, while R is a statistical programming language.
However, according to recent trends and the data scientist community, Python is more versatile than R making it a default choice for data science projects. Besides, you can use Python for data manipulation, web app development, and building ML algorithms. At the same time, R has limitations in these fields but is a dominant choice for statistical research and data visualization.
Python is in more demand compared to R due to its readability, simplicity, ability to build complex projects, and reliable performance.
Here are some of the major reasons for increasing Python demand
Yes, you can use Python for data science projects. In fact, Python is one of the widely used and preferred open-source languages by data scientists to execute various data science projects. Besides, the functionality of Python to deal with mathematics, statistics, and scientific functions is impressive, including the availability of multiple libraries and packages, making it incredibly productive and versatile.
Apart from Python and R, JavaScript, Scala, SQL, Julia, C/C++, MATLAB, and SAS are some of the programming languages wisely used in data science.
Yes, you can use Python and R together in the same project. For example, use Python for data collection and cleansing and R for data visualization. The rpy2 library allows calling R functions from within Python. Else, you can use tools such as Jupyter Notebook to mix codes from both languages to get the desired outcome.
Your Success Is Guaranteed !
We accelerate the release of digital product and guaranteed their success
We Use Slack, Jira & GitHub for Accurate Deployment and Effective Communication.


