Built a Real-Time Executive Analytics Dashboard in Tableau for Medisight


Medisight is a healthcare analytics platform that assists care providers in consolidating clinical and operational information. It allows teams to measure their performance and assess various metrics. To eliminate all the delays caused by disconnected systems and batch reporting, Medisight partnered with Bacancy to build a real-time executive analytics dashboard using Tableau and automated data pipelines.


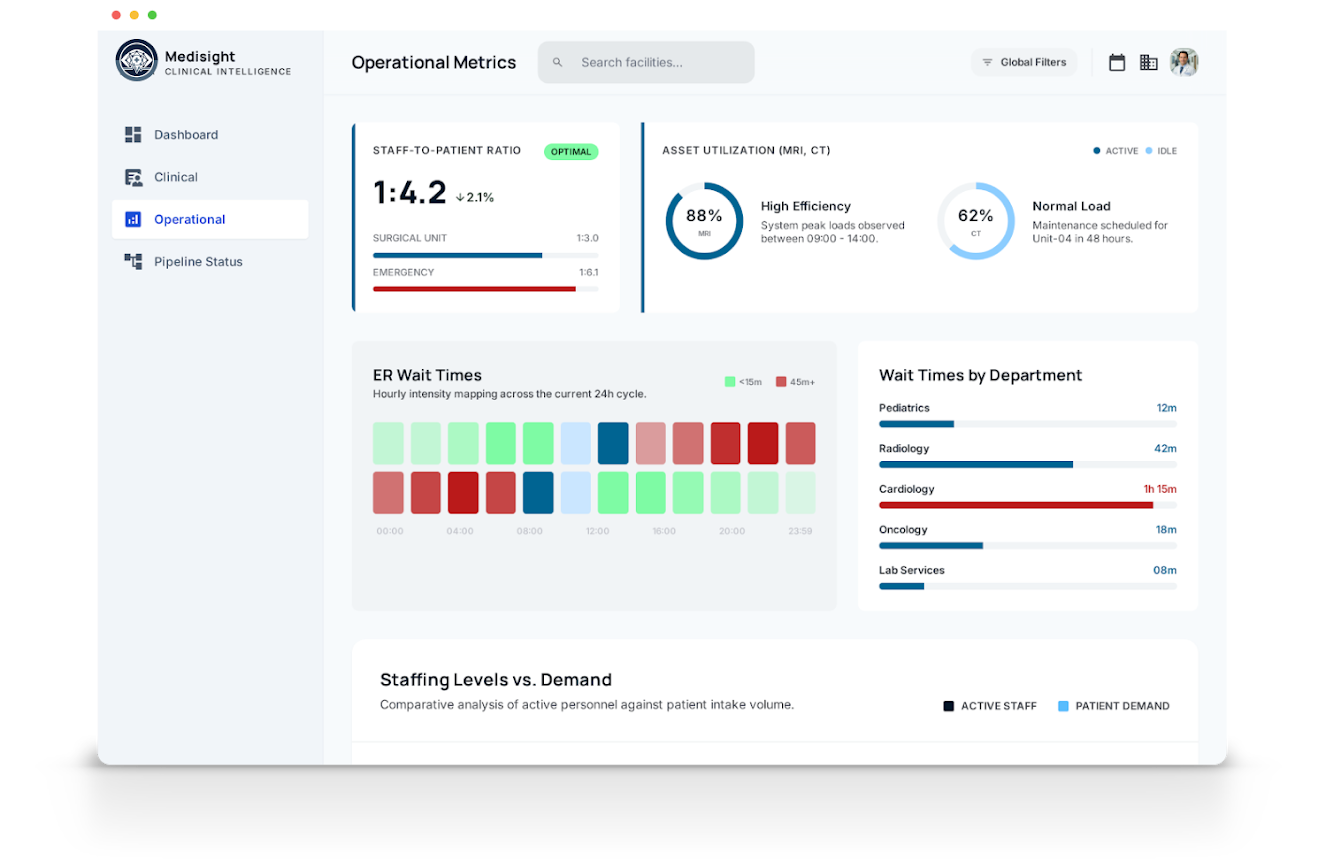
Real-Time Executive Dashboard
Centralized Healthcare Analytics Layer
Automated Data Pipeline System
Interactive KPI Visualization Engine
Create a single analytics platform by combining data from different healthcare databases.
Build a reporting system that removes delays and supports real time processing.
Process continuously updating data without breaking accuracy and consistency.
Design executive dashboards to make healthcare metrics simple for quick decisions.
Our Tableau developers created a centralized data architecture that had automated pipelines, query optimization, & data modeling to allow real-time analysis throughout the system.
We created dashboards on Tableau, which have KPI layouts, real-time filters, and dynamic visuals for tracking purposes across multiple business operations.
ETL pipelines were created with the help of Python and SQL programming languages and with schedule- and event-driven mechanisms for updating data continuously.
Our team effortlessly improved Snowflake performance by optimizing queries, partitioning data, and refining data models for faster efficient processing.
Centralized dashboard with real time KPI visibility
Automated data pipelines with continuous sync
Interactive filters with dynamic drill-downs
Unified analytics across clinical & operational data
04

February 2026 - March 2026

Reduced reporting turnaround from 48 hours to near real time visibility
Enabled executives to access live operational and clinical KPIs for faster decision-making
Eliminated manual reporting workflows through automated data pipelines
Improved decision-making speed with centralized, real time insights
Established a scalable analytics layer for future healthcare data expansion
Enabled proactive monitoring of healthcare operations with real-time alerts & updates
| DATA VISUALIZATION | Tableau |
| DATA ENGINEERING | SQL Python ETL Pipelines |
| DATABASE | Snowflake |
| CLOUD PLATFORM | AWS |
![]() Watch the video
Watch the video
![]() Watch the video
Watch the video
![]() Watch the video
Watch the video
![]() Watch the video
Watch the video
![]() Watch the video
Watch the video
![]() Watch the video
Watch the video
![]() Watch the video
Watch the video
![]() Watch the video
Watch the video
![]() Watch the video
Watch the video
![]() Watch the video
Watch the video
![]() Watch the video
Watch the video
![]() Watch the video
Watch the video
![]() Watch the video
Watch the video
![]() Watch the video
Watch the video
![]() Watch the video
Watch the video
![]() Watch the video
Watch the video
![]() Watch the video
Watch the video
Get access to an experienced team of developers and engineers from Bacancy, handpicked to ace your goals. Kickstart within 48 hours, no-risk trial.
Years of Business Experience
Happy Customers
Countries with Happy Customers
Agile Enabled Employees